

Goal mapping creates a visual plan by anchoring a central theme at the center, branching subgoals outward, color-coding life areas, and adding SMART specifics to each branch. The visual structure surfaces relationships the linear list quietly hides.
Quick answer: Goal mapping ideas that create a clear visual plan start with a central-theme map, then add a life wheel map, SMART branches, quarterly checkpoints, and color-coded priorities so the year’s goals sit on one page.
The kitchen table on a Saturday morning, the second cup of coffee cooling beside the laptop, the large blank poster board pulled from the closet and laid flat against the wood grain. The colored markers rolled out beside it, the dotted notebook open to the rough draft, and the first central word written in the middle of the board, slightly bigger than necessary, deliberate the way the first word always is.
Goal mapping is the practice of laying out the year (or the quarter, or the next 90 days) as a visual diagram rather than a linear list. A central theme at the core. Branching subgoals radiating outward. Color coding for life areas (work, money, health, relationships, creativity, learning).
SMART specifics attached to each branch. The map activates a different cognitive system than the bulleted list activates, and the visual structure surfaces relationships between goals the linear version quietly hides.
Mind-mapping research from Tony Buzan onward has consistently found the spatial structure produces better recall, better prioritization, and better identification of conflicts between goals before those conflicts derail the year.
The central-theme architecture also forces an honest choice about what the year is actually for, which is the choice the goalless drift and the 47-bullet annual plan both quietly avoid.
Recommended Goal Mapping Supplies at a Glance
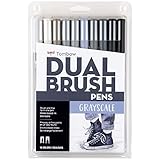
Five practical supplies for the mapping session. The numbered ideas further down are the actual structures to map.


Recommended blogs to read:
- Smart Goal Setting That Actually Produces Results
- How to Create a Vision Board That Actually Works
- Goal Examples to Set for Every Season of Your Life
- Goal Setting Journal Prompts to Finally Get Unstuck
- Set Intentions That Actually Show Up in Your Week
Why the Visual Map Outperforms the Linear List
Tony Buzan’s mind-mapping research at the University of Toronto and the various studies that followed found the spatial structure of a mind map produces better recall, better association of related ideas, and better prioritization than the equivalent content in a linear bulleted list.
The mechanism is the brain’s preference for visual hierarchy: the central node claims primary cognitive real estate, the first ring of branches claims secondary attention, and the leaves carry the specifics.
The structure is how the information actually gets organized in long-term memory, so the map matches the brain’s filing system rather than fighting it.
The second mechanism is conflict surfacing. The linear list of 12 annual goals presents them as parallel and equally weighted, which they almost never are. The visual map immediately reveals that three of the 12 goals require the same time slot, two of them require incompatible energy windows, and one of them is actually a sub-step of another.
The map surfaces those conflicts in the first 30 minutes of the session, which is exactly when they can still be resolved. The linear list buries them under the appearance of coherence and lets them quietly sabotage the year from inside the plan.
The 10 Goal Mapping Structures Worth Building
Ordered by clarifying power. Pick one structure for this mapping session. Add a second layer only after the first map has been used for a month.
1. The Central-Theme Map

Write the year’s one-word theme in the center of the board. “Stability,” “Build,” “Recover,” “Launch.” Branch six life areas outward from the theme. Branch two to three concrete goals from each area. The central theme forces a single organizing decision the rest of the map serves, which is the single largest differentiator between maps that hold across the year and maps that fragment by March.
2. The Life Wheel Map


Draw a circle in the center. Divide into six or eight wedges (career, money, health, relationships, creativity, learning, fun, contribution). Score each wedge from 1 to 10 on current satisfaction. The low-scoring wedges become the focus areas for the year’s goals.
The wheel makes the imbalance visible in 90 seconds, which is exactly the kind of visible imbalance the linear list cannot produce.
3. The SMART Branch Map


Each branch on the map carries a SMART structure on its leaves. Specific outcome. Measurable marker. Achievable from current baseline. Relevant to the branch’s life area. Time-bound to a specific quarter. The SMART specifics convert the abstract goal (“get healthier”) into the executable version (“run a 10K by August 15, building from current 0.5-mile baseline through a structured 12-week plan”).
4. The Quarterly Checkpoint Map

![[By Ryder Carroll] The Bullet Journal Method: Track the Past, Order the Present, Design the Future...](https://m.media-amazon.com/images/I/51u-mrU+o-L._SL160_.jpg)

Map four quarters as four colored zones radiating from the center. Each annual goal gets a checkpoint placed in the quarter it should be achieved by. The 12-month summit gets reached through the four quarterly campsites, each with its own check-in. The structure prevents the December scramble pattern that the all-annual-goals-due-by-December approach produces.
5. The Habit-and-Goal Pair Map


Beside each annual goal on the map, write the daily or weekly habit that will produce it. Goal: read 24 books this year. Habit: 20 pages every morning with coffee. Goal: save 8,000 dollars.
Habit: 300 dollars auto-transferred per paycheck. The habit-goal pairing is what bridges the annual abstraction to the daily execution, and it is the bridge most goal maps quietly skip.
6. The Color-Coded Priority Map


Color-code the map by priority rather than by life area. Red for the three most important goals of the year. Yellow for the secondary five. Blue for the background ten that would be nice but are not central.
The color hierarchy makes the priority weighting visible at a glance, which is exactly the weighting the linear list erases under the appearance of equal status.
7. The Future-Self Map


Write “December 31” in the center along with the future-self identity statement (“I am a person who runs consistently, saves automatically, and has finished the book draft”). Branch the supporting goals from the identity. The identity-first structure ties James Clear’s identity-based habits frame from Atomic Habits directly to the visual map, which is where most identity-based plans quietly disconnect.
8. The Constraint Map


Branch each goal alongside the realistic constraints around it. Time available per week. Budget. Energy window. Existing commitments. Skill gaps. The constraint surfacing is the honest layer the aspirational map skips, and it is what produces the plan that survives contact with real life instead of the plan that collapses on contact.
9. The Domain-Connection Map


Use washi tape lines to connect goals across domains that share resources or compound on each other. The running goal connects to the energy goal. The reading goal connects to the writing goal. The savings goal connects to the freedom-to-take-the-stretch-job goal. The visible connections produce the strategic advantage the isolated goal list misses entirely.
10. The Weekly-Review Map


The final layer. A small section of the map reserved for the weekly Sunday review notes. What worked. What did not. What got adjusted. The map becomes a living document the year actually uses, rather than the January artifact that gets rolled up and forgotten by April. The review section is what keeps the map connected to actual life.
How Long Before the Map Starts Producing Real Direction
The first measurable shift arrives the day the map gets built. The central theme produces an immediate clarity about what the year is actually for. The constraint surfacing reveals the conflicts that would have derailed the year quietly. The SMART branches convert the abstract goals into executable specifics.
Weeks one through three are the discomfort window where the map’s structure feels like extra overhead and the temptation to abandon it for the familiar linear list is strongest.
The deeper compounding gains arrive between months three and twelve. The quarterly checkpoints have produced their first set of completions. The habit-and-goal pairings have produced visible compounding. The Sunday weekly review section has filled with the year’s actual adjustments. The color-coded priority structure has prevented the secondary goals from quietly crowding out the three central ones.
The map has become the strategic document the year is actually being lived against, which is exactly what the visual structure was designed to produce.


Goal Mapping FAQs
What is goal mapping?
Goal mapping is the practice of laying out goals as a visual diagram with a central theme at the core, branching subgoals radiating outward, color coding for life areas, and SMART specifics attached to each branch. The spatial structure surfaces relationships and conflicts the linear list quietly hides.
How do you make a goal map?
Write the year’s one-word theme in the center of a poster board or large notebook page. Branch six life areas outward. Branch two to three concrete goals from each area. Add SMART specifics to each leaf. Color-code by priority. Use washi tape to connect goals that share resources or compound on each other.
What is the difference between mind mapping and goal mapping?
Mind mapping is the general visual brainstorming technique Tony Buzan developed. Goal mapping is the specific application of the mind map structure to annual or quarterly goal planning. Goal maps add the SMART specifics, the quarterly checkpoints, the habit-goal pairings, and the weekly review structure mind maps do not typically include.
Do visual goals work better than written ones?
The research from mind-mapping studies consistently shows the spatial structure produces better recall, better association of related ideas, and better prioritization than the equivalent linear text. Visual goals work better when they include specific SMART content and habit pairings, not when they remain at the inspirational-imagery level.
How often should I update my goal map?
Build the map once at the start of the year or quarter. Review weekly during the Sunday review (15 to 30 minutes). Update notes in the weekly review section. Rebuild the central structure quarterly. The map is a living document, not a static artifact.
What supplies do I need to make a goal map?
A large poster board or large dotted notebook page. A set of brush pens or markers for the branches. Colored pencils for the priority coding. Washi tape for the domain connections. Sticky notes for the moveable goals. A pen for the SMART specifics on each leaf.
Key Takeaways
- Goal mapping creates a visual plan by anchoring a central theme at the core and branching subgoals outward.
- The spatial structure activates a different cognitive system than the linear list and surfaces conflicts the list hides.
- Color-code by priority (red for the three most important goals, yellow for secondary five, blue for background ten).
- Pair each goal with the daily or weekly habit that will produce it. The habit-goal bridge is what makes the map executable.
- Map quarterly checkpoints. The 12-month summit gets reached through four quarterly campsites with their own check-ins.
- Build once. Review weekly. Update notes in the review section. Rebuild quarterly. The map is a living document.
Which Goal Mapping Layout Should You Try First?
Goal mapping turns the annual plan into a visual structure the brain actually files and uses. Central theme at the core. Branches outward. Color coding for priority. SMART specifics on each leaf. Quarterly checkpoints visible at a glance.
Habit-and-goal pairings making each annual abstraction executable. Washi tape connections showing where goals compound on each other. The map is the strategic document the year gets lived against, and the visible structure is what keeps the central three goals from being quietly crowded out by the background twelve.
Build the map this weekend. Hold it for the year. Adjust the weekly review section as the year teaches the map what it needs to know.
If you’d rather begin from a structured page, my goal-setting template feeds straight into the SMART branches, and these new year goal-setting steps help you choose the central theme.
Last update on 2026-10-07 / Affiliate links / Images from Amazon Product Advertising API